
Introduction
Across the world, diamonds are renowned as the “ultimate gemstone.” In jewelry, they symbolize commitment and love. Because of their significant value, diamonds can be a major financial investment for the average consumer. Their price is influenced by four categories: carat, cut, color, and clarity. To help people maximize their budgets, our team asked, “Which of the 4 Cs affects diamond retail prices the most?” Our research question remained consistent throughout the analysis because of the data's simplicity and readability.
Data Description
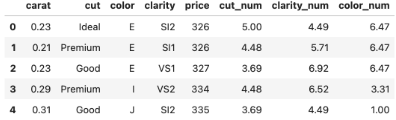
To answer our question, we used the Gemstone Price Dataset from Kaggle, which originated from ggplot2. The dataset contained 53,940 rows and 11 columns: Unnamed 0, carat, cut, color, clarity, depth, table, price, x, y, and z. We removed duplicate rows and rows with dimension values of 0, leaving 53,755 rows. We then retained only the carat, cut, color, clarity, and price columns needed for our research question. Because cut, clarity, and color were categorical variables, we converted their values to numbers using an established 1–8 scale.
Data Exploration
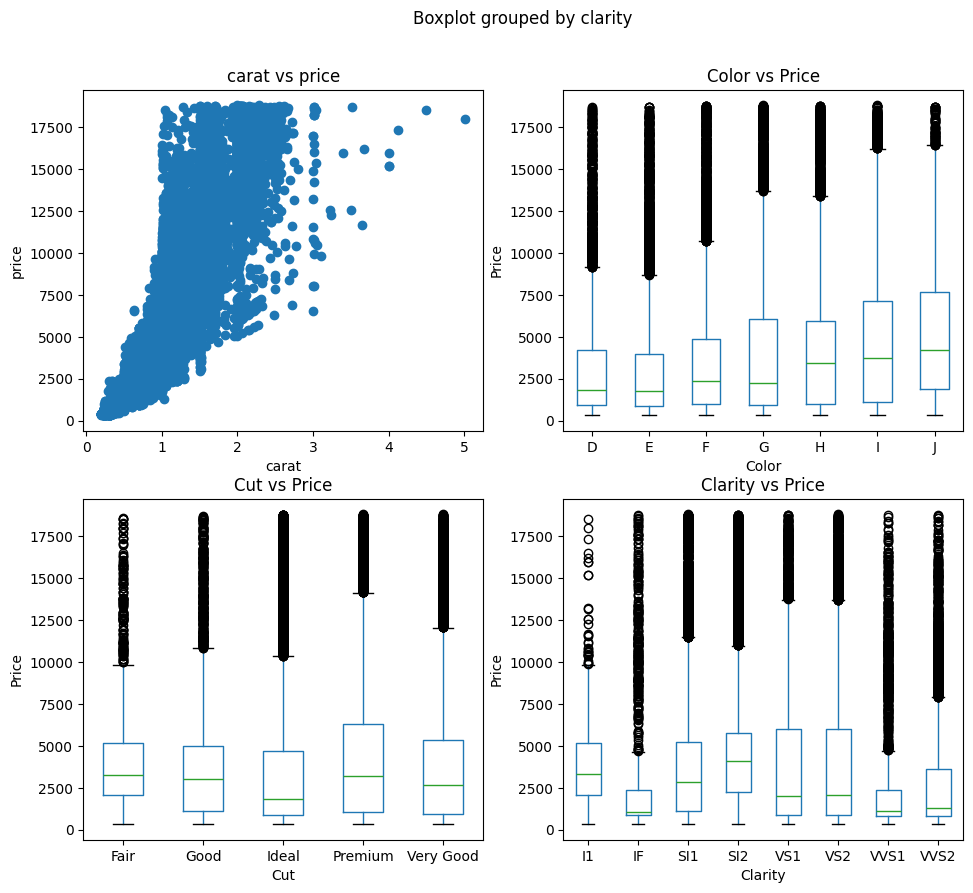
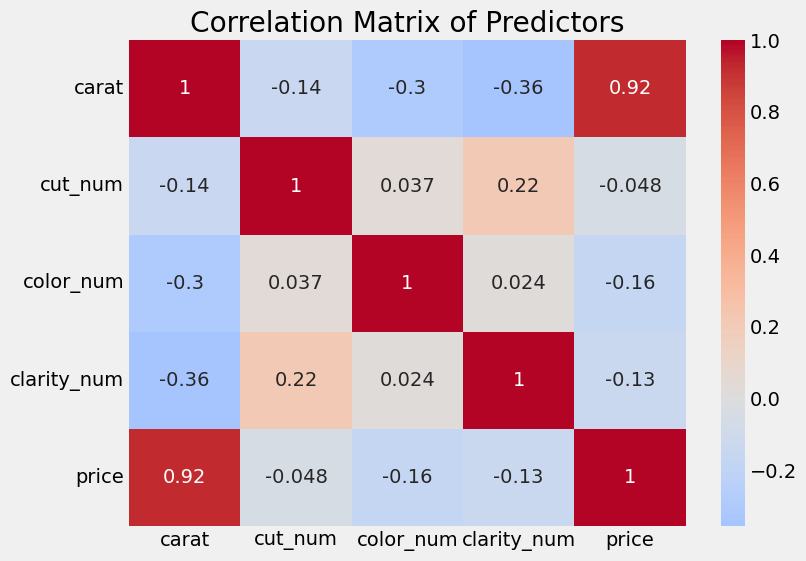
The cleaned dataset contained 53,755 rows and 8 columns. To better understand it, we created several visualizations. First, we graphed carat versus price as a scatter plot. For color, cut, and clarity, we used box plots to prevent the categorical data from clustering around only a few x-axis values. Interestingly, price decreased as color quality increased. We also created a correlation matrix, where carat and price had a coefficient of 0.92, indicating a very strong correlation.
Model
Multiple Linear Regression
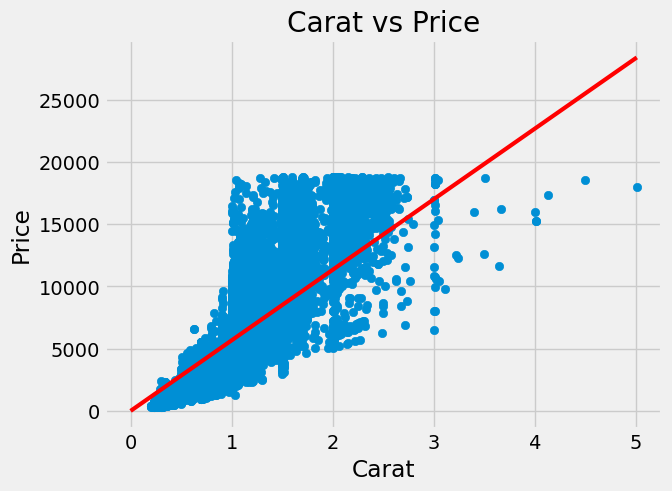
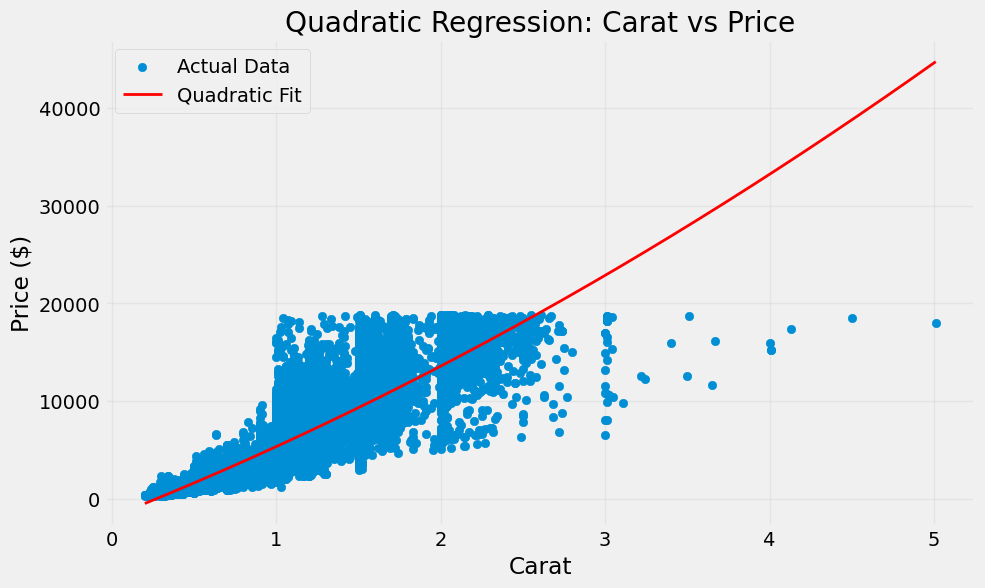
We assessed three models. Our first was a multiple linear regression model using the 4 Cs as features. After observing an upward curve in the data, we used a second-degree polynomial regression because we believed it would provide a better fit. We split the data into an 80% training set and a 20% testing set, fit the model, and produced the following equation:
Price = -5707.877 + 3773.190(carat²) + 145.228(cut_num) + 358.693(color_num) + 613.223(clarity_num)
Train R² Score: 0.841
Random Forest
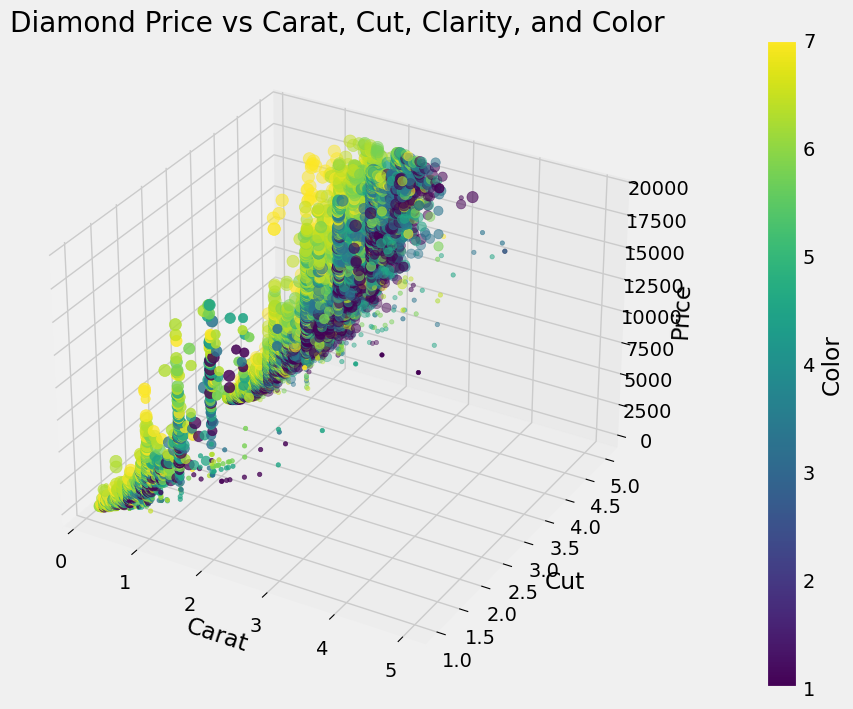
We then chose a random forest model because it can capture nonlinear relationships better than standard linear regression. For example, increasing carat from 0.5 to 1.0 does not affect price in the same way as increasing it from 2.5 to 3.0, even though linear regression treats them as equal intervals. Random forests also require little tuning and resist overfitting because each tree sees a slightly different sample of the training data. Averaging the trees' predictions reduces variance, and the model can learn interactions between features, such as the higher price of large-carat diamonds with high clarity. Using 500 estimators and a maximum depth of 10, we achieved:
Test R² = 0.98
This outperformed the linear regression model, as shown by the higher R² score.
Gradient Boosting
Finally, we implemented gradient boosting, which captures nonlinear relationships and feature interactions like a random forest but improves sequentially by correcting previous mistakes. The model begins with an initial price prediction, measures the residual between the actual and predicted prices, and trains a small decision tree to predict those errors. Repeating this process allows the model to become increasingly accurate. Using 500 iterations, a maximum depth of 10, and a learning rate of 0.01, the model achieved a test R² of 0.98.
Results
Based on the linear regression coefficients, carat was by far the strongest predictor of price, followed by clarity, color, and cut. For the final model, however, we selected gradient boosting because it produced the highest R² score and best represented the nonlinear relationships in the data.
Presentation
If the presentation does not load inline, you can open it directly here: Presentation - Project 5 Diamonds.pdf
Report
If the report does not load inline, you can open it directly here: Report - Project 5 Diamonds.pdf
Video
If the video does not load inline, you can open it directly here: Google Drive video
Collaborators: Eric Yan, Dheeraj Garg, William Lu